
The simple and quick to complete Data Quality Improvement Assessment helps organisations understand their next steps so they can take appropriate action around how to move forward with their data initiatives.
Below I have outlined the stages to the curve. The assessment has 4 stages, ranging from a very basic grasp of the importance of data quality to a fully governed data quality environment.
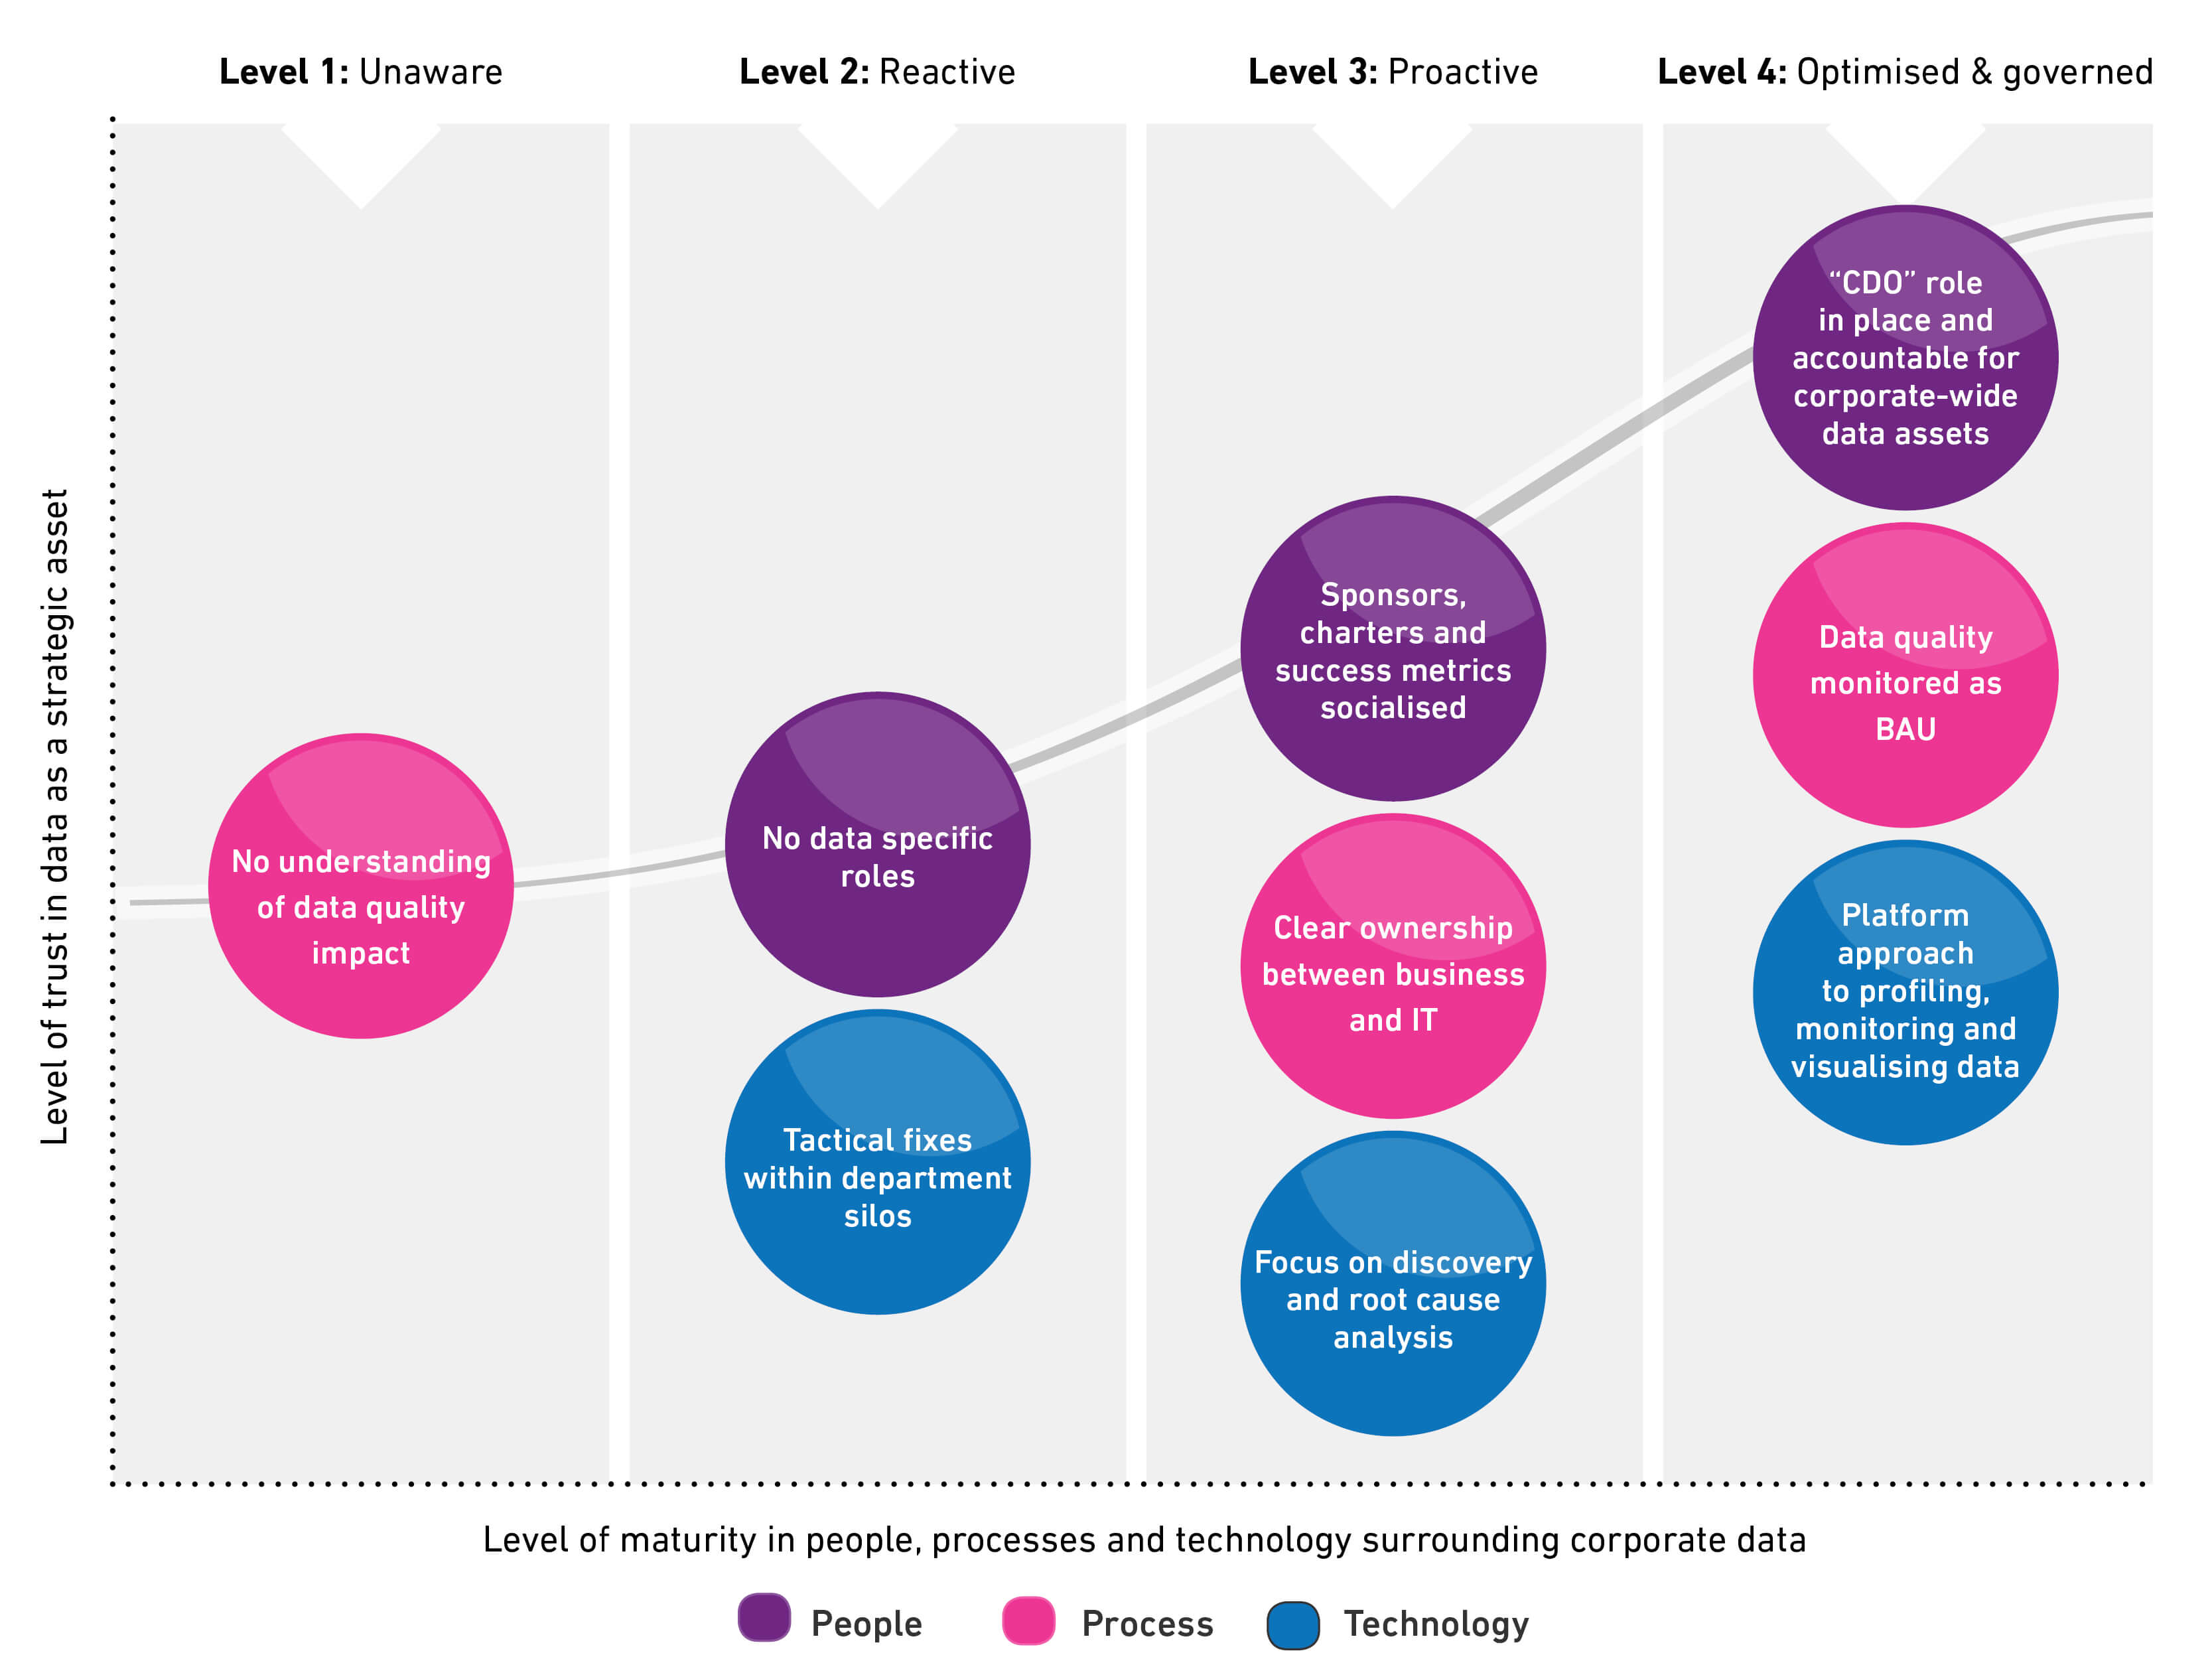
Stage 1: Unaware:
What does this mean?
If you land here, your organisation has limited understanding of the concept of data quality and the impact it can have on the business. There is a sense of apathy towards the issue of data quality across the organisation, particularly at senior management levels. Business users see data as “good enough” and regularly introduce workarounds where information is often sub-standard and not fit for purpose.
Stage 2: Reactive:
What does this mean?
Your organisation is starting to react to data quality issues as they impact on business performance but you have yet to assign any data specific roles. You lack a coherent strategy when dealing with data at a corporate-wide level and use tactical point tools within departmental silos for issue resolution. It’s likely that the motives behind any investment in data quality will be in response to a compelling event that has caused the business significant short-term pain (e.g. breach in compliance).
Stage 3: Proactive:
What does this mean?
Your organisation has become more proactive with its data quality efforts. You’ve started to define roles and create charters that help to take a more cohesive and unified approach to data management. A better understanding of data processes has begun to break down departmental silos, allowing for collaboration and prioritisation between IT and business users. Your organisation is also now likely to be considering the improvement of a broader range of data domains out with customer/party data (e.g. product/financial/location etc.), and you have begun to utilise technology for data profiling and discovery to help realise the value of your data assets more clearly and have a more structured process for root cause analysis.
Stage 4: Optimised and Governed:
What does this mean?
It’s all very positive. Your organisation has developed a fully governed data quality environment and you can clearly communicate the link between data quality and financial performance to the board. Data has a single owner or entity that is responsible for the maintenance of the corporate-wide information management strategy. This would include well communicated and well documented rules, controls and processes for monitoring performance metrics closely. Your organisation takes a consolidated approach to technology investment, only partnering with vendors that can complement and/or integrate into your existing and established information management practices.
 Take the Data Quality Improvement Assessment to find out where you land and to get practical advice on how to drive your data quality initiative further.