Data can transform your approach to detecting and preventing financial crime
By identifying the characteristics of money launderers and fraudsters, creating adverse markers, and improving transaction monitoring, businesses can protect themselves, and the economy, from financial crime.
We’ve been working to understand the behaviour of money launderers and how they use UK companies to commit their crimes.
Through using a blend of data sources, we’ve identified the traits of a money launderer and what actions could be cause for suspicion.
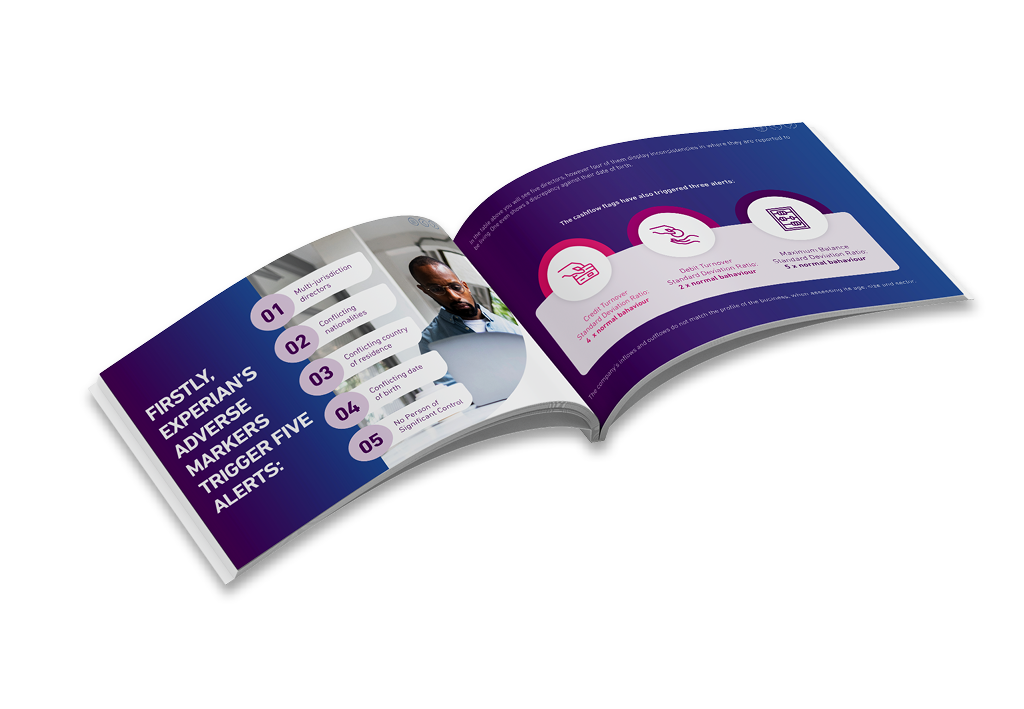
Characteristics of money launderers
We have identified key characteristics of money launderers, how they behave and patterns of suspicious behaviours.
Adverse markers
We have developed over 50 adverse markers to help businesses identify suspicious activity.
Transaction monitoring
What are the patterns in transactions which could indicate money laundering?
In this white paper, we cover:
How to recognise a money launderer
What are their key characteristics?
How can transaction monitoring help
What are the current challenges in transactional monitoring?
True financial crime stories
Where have we detected suspicious behaviour through data?
What's next for fincrime prevention
Using the latest innovations in data and analytics to hinder financial criminals.
A sneak peek into...
Helping to drive financial crime out of the UK economy
Adverse Markers – Warning signs to look out for
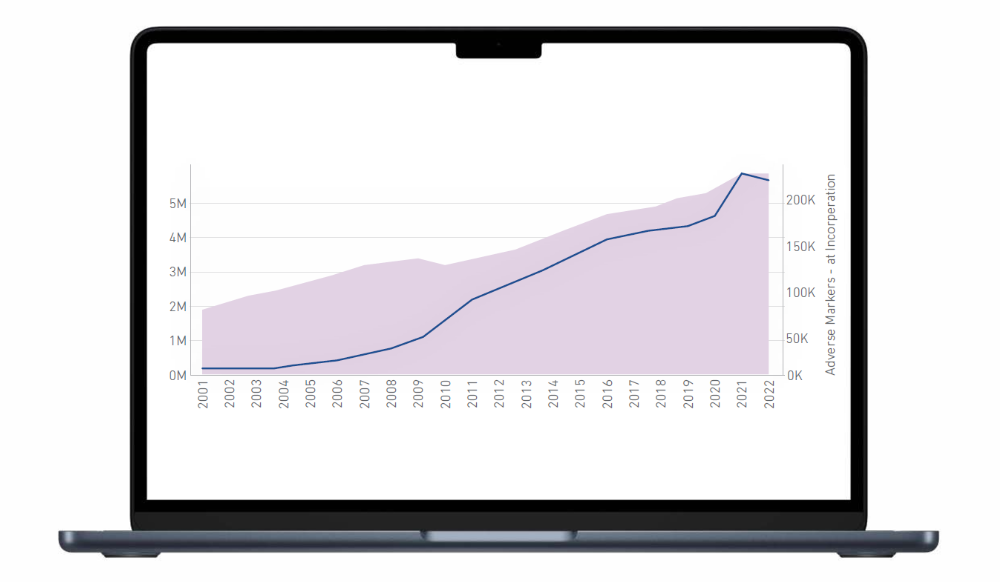
Leveraging this understanding of money launderers’ characteristics, we have catalogued over 50 adverse markers that can help businesses identify concerning behaviours. From multiple directors in different or high-risk jurisdictions to marked increases in cash inflow and outflow, the markers alert us to potentially suspicious activity. The more markers, the greater the likelihood of criminal activity. We have recently completed some analysis on the adverse marker population, comparing it to the general business population.
The graph shown gives striking evidence of how adverse markers can flag questionable behaviour, even at a macro level. The shaded area represents the growth of the UK business universe between 2001 and 2022. The blue line illustrates the adverse marker population; those businesses exhibiting one or more adverse markers.
While we can see the adverse marker population is growing at a faster rate than the UK business universe, there is a particularly marked increase in growth from 2020 to 2021. At a time when the government was offering unprecedented support to businesses (due to Covid), and when it had been reported that fraud in government-backed schemes was rife, we see an exponential increase in the adverse marker population.
Did you enjoy the read?
Download the full report
To find out more about identifying money launders and how transaction monitoring may help, download our report.
Further reading

Financial Crime: your complete guide
An ever-present threat for sectors and businesses across the world. Learn how data sharing can help with regulatory compliance and prevent your risk of FinCrime.
Sharing industry transaction data to tackle financial crime
Financial criminals transferring funds through accounts across the UK can be detected and prevented through sharing transactional data. Read our paper to find out more.

Money mules
Learn how money mule fraud works and how businesses can get ahead of suspicious activity to prevent it from happening in this guide.

Why multi-sourced third-party data is key for detecting and preventing financial crime
Never before has it been so vital that you adopt multi-source corroboration of your customers data and refrain from using only Companies House data in your Customer Risk Assessment.

Why high-quality B2B data is the foundation of email performance
Investing in accurate, comprehensive B2B data creates a foundation that improves every email you send, and every digital interaction that follows.

Are you actually reaching the right people?
Discover the signs your B2B targeting data is out of date and how better data quality can improve email deliverability, engagement, and pipeline results.

Trade credit in business: A guide
Trade credit allows businesses to buy goods and services from other companies without paying immediately. Understand the types, uses, pros and cons.

How lenders win on price comparison websites
Explore how real‑time optimisation, data‑driven decisioning and self‑serve strategy tools help lenders compete and maximise profitability on PCWs

The role of the DBS Update Service in education – and why Experian includes it
The DBS Update Service allows employers to keep a candidate’s DBS certificate current without requesting a new check every time they change roles.

How reliable vehicle verification can boost your business
As an automotive retailer, how can you find out the true history of a vehicle? Or are you unsure if you're overpaying for a vehicle? See how data can help.