Make the best business and marketing data-driven decisions across Europe
European consumer and market insights
Do you operate in Europe? Do you need to make the most informed decisions about where to locate a new office or store; which European regions or countries you should be prioritising for your products, services, and digital campaigns; or how you should be developing your products or services to maximise your success in different European cities or countries?
To make the best business and marketing decisions across Europe, organisations need to fully understand local markets based on consumer needs and preferences, as well as their income levels and spending.
Europe is a hugely diverse continent. From large cities to remote mountain passes, from polar ice caps in the north, to warm beaches in the south, Europe’s geographical richness is matched by a high level of economic and cultural diversity. The result is that European consumers, and local markets in different countries, are often challenging to understand and navigate.
By having a clear view of consumer populations and their behaviours, attitudes, and spending across Europe, you have the market insights you need to plan, deliver, and market your products and services where demand is highest and the commercial opportunities are the most compelling.
Bringing European data insight to life
Organisations around the world need to target ideal customers, to increase the impact of their marketing and advertising investments, and to make informed decisions on expansion into new countries or into new markets.
Below is an example of a use case for expansion using basic, high level market data for analysis.
Imagine you’re a fast-growing food brand looking to understand potential growth opportunities in different European regions and countries and, by extension, where new sites can be located for the best outcomes.
At a glance, our data visualisation below can help you see:
Nordic countries
- The Nordic countries (including Norway, Denmark and Finland) spend the most on food and non-alcoholic beverages, with little variation between countries.
Western Europe
- In Western Europe (including Germany, Austria, France and United Kingdom), the UK spends €1,937 per year on food and non-alcoholic beverages, whereas French consumers, who have a similar income level, spend an average of €2,781 per year.
Southern Europe
- Southern Europe (including Spain, Portugal, Greece, and Italy) typically spends more than €700 more on food and non-alcoholic beverages than Eastern European consumers.
The Balkans
- The Balkans (including Serbia, Romania, Bulgaria and Croatia) spend the least on food and non-alcoholic beverages (almost €250 less than the rest of Eastern Europe).
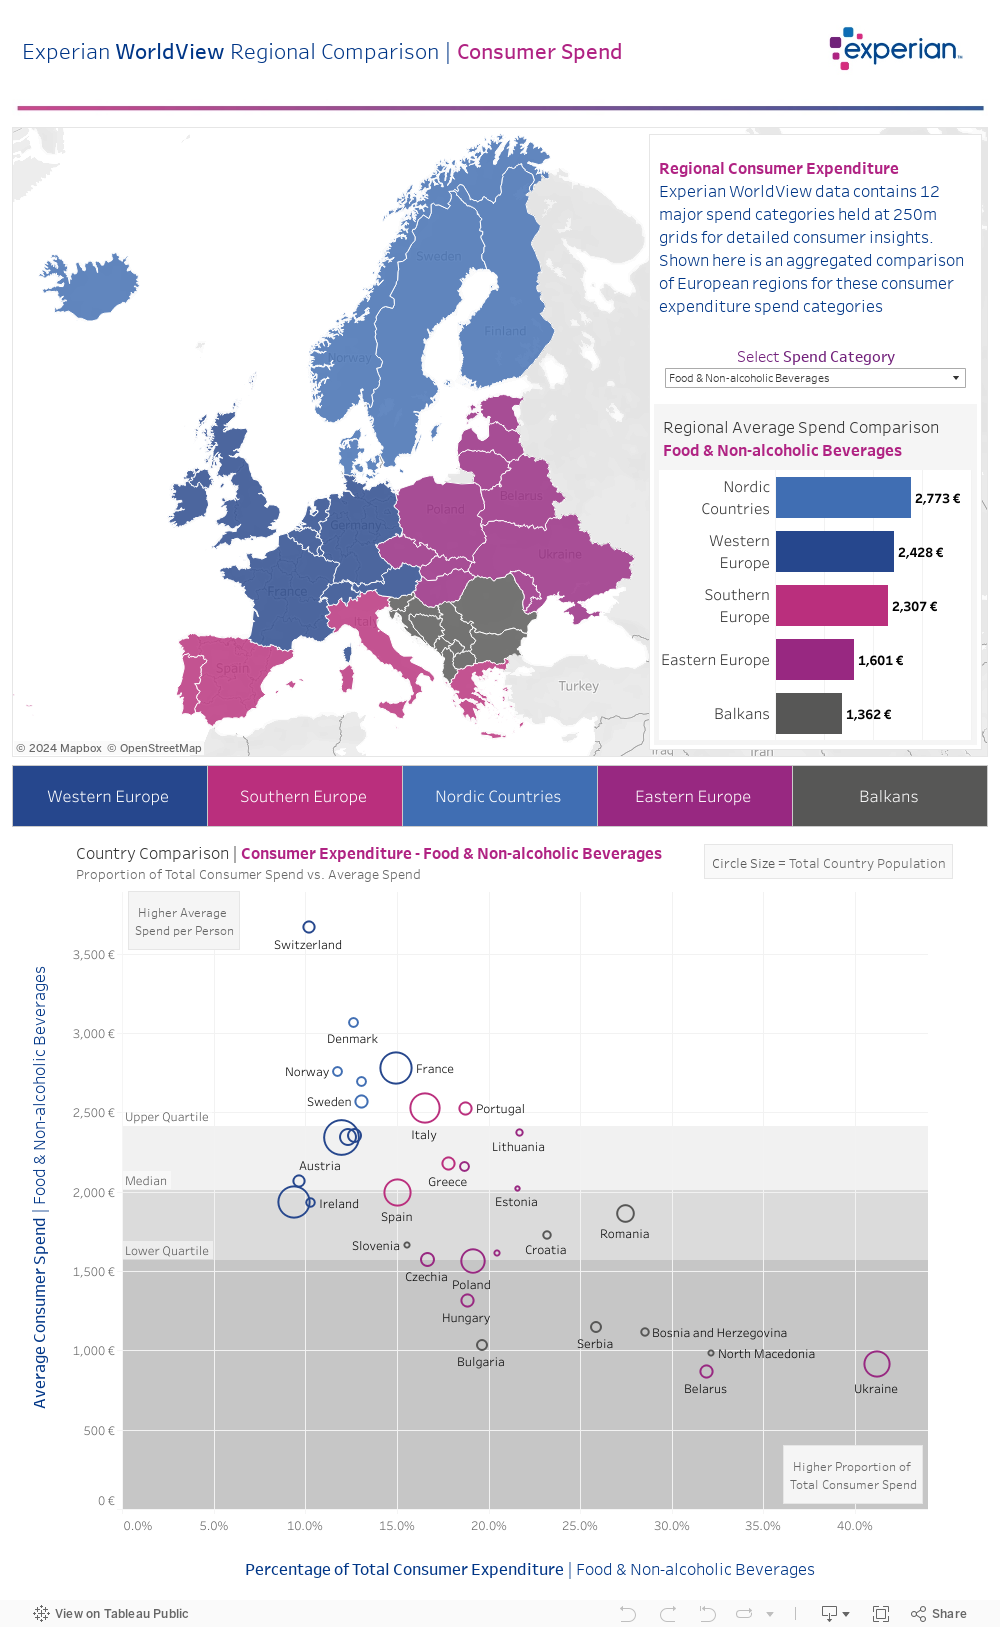
Decision makers at our food brand can also see markets represented by size, with access to key datapoints, including the average consumer spend on food and non-alcoholic beverages and what this represents as a percentage of consumers’ overall disposable incomes.
The data shows that:
- The population (and, therefore, the size of the market), is almost identical in the UK and France (both representing some of the largest markets in Europe)
- The average spend on food and non-alcoholic beverages in France (€2,781) represents 15% of consumers’ disposable incomes
- The average spend in the UK in this category (€1,937) represents just 9.4% of consumers’ disposable incomes.
You can see, at a glance, that there seems be more headroom for increased consumer spending on food and non-alcoholic beverages in the UK than in France – which may inform future expansion plans, or additional research into local market opportunities in the UK
You can manipulate the above data visualisation to view alternative spend categories such as transport, clothing and footwear, hotels & catering, and more.
Filling the data gaps on European consumers and markets
The above example demonstrates how a consistent, single source of insight that fills data gaps on local consumers and markets provides a shortcut to a clear shortlist of countries and possible locations where demand, disposable income, and customer demographics all favour positive outcomes for the business.
Sourcing global socio-demographic information has previously been difficult. Data from different providers, and for different countries, is often inconsistent and may only provide a partial view of consumers and markets in specific areas of Europe. We’ve overcome these challenges and can help you to optimise your business and marketing strategies in a number of key ways.
1. Access Pan-European market insights – all in one place
We can help you overcome the challenges of limited or fragmented consumer and market data across Europe. We do this by providing consistent, yet granular, consumer data across the whole of Europe, by region, by country, by city or area, and for every single 250m by 250m grid.
The variations in spending and disposable income between different types of consumers in different geographical locations across Europe provides a clear view of where market opportunities exist, and where markets are already saturated.
2. Target the right customers across Europe to maximise your campaign return on investment (ROI)
To target customers effectively with your products, services, and campaigns, you need to know who they are, what they want and need, and what makes them tick.
We enable this by segmenting consumers into different groups based on shared characteristics, from age and spending behaviour, to their disposable income and attitudes about what brings them the most value.
The 10 key customer ‘segments’ which include upmarket homeowners, aspiring families, affluent elders, family economy, rural communities and others, help businesses to make more informed product development decisions, locate new sites closer to target customer populations, and fine-tune marketing and advertising strategies to maximise impact and ROI.
3. Understand consumer spending across 12 key product and service categories
To help you understand where new market opportunities exist, we can provide comprehensive data on consumer spending across 12 key categories, from housing and transport, to communications, food and non-alcoholic beverages and leisure and recreation.
The ability to compare granular spending data between European cities and countries helps you understand where market opportunities exist, or where markets may already be saturated, helping you to prioritise your efforts and locate your sites in the most favourable areas.
4. Get more granular consumer insights based on ‘grid-level’ demographics to boost your commercial success
Area-level demographics can be misleading, or at least unable to represent subtle market differences such as income inequality within a particular city or between postcodes. To really understand differences in consumers’ circumstances and behaviours on a granular basis, data has to account for differences between people living in different areas of a city – or even a few streets away.
This is where grid-level demographics comes in. Our data, for example, uses 250m by 250m grids to provide a uniquely granular depiction of consumer traits across cities and wider geographical areas. Our customers can choose to have data represented either in 250m grid squares, or using the H3 geospatial indexing system, which uses precision hexagonal ’tiles’ which cover the entire European continent – each one with its own unique identifier.
How can we help?
We’ve provided location analytics and market planning support to global brands for over 20 years. Today, some of the world’s most iconic brands use our international data and insights to plan their next European location, to understand their customers, to target their campaigns more effectively and to activate their campaigns across multiple digital channels.
Unique benefits of our data include:
- ‘Apple to apple’ comparisons – This is based on consistent, accurate consumer and market data across every country in Europe
- A single data provider across the whole of Europe – Which speeds up deployment and simplifies commercial arrangements
- Competitive pricing – With a single source for pan-European market data, new countries or regions can be added economically on request
- Multiple, flexible delivery options – With the choice to access raw data, to overlay data onto a GIS map, or to access the data via a Directory or API, as needed
- Simple, direct activation – Our data can be activated instantly and directly through digital channels such as DOOH (Digital Out Of Home) and programmatic advertising across many markets
Want more information?
With the right data, you can make effective decisions about your international growth strategy, from location planning to consumer marketing activities.
With Experian WorldView we can provide you with immediate access to geo-level insights to help you make effective global location planning decisions and run marketing campaigns.
Get in touch
Get in touch and we can help you create a robust plan for international expansion.
Let's talkFurther reading

Mergers and Acquisitions review: Q1 2026
How has the UK Merger and Acquisitions market performed in Q1 2026? Read the latest Marketing insights in our M&A review for Q1 2026.

Consumer Data: How to improve your decisions using data
See why consumer data is essential for understanding your audiences and delivering better experiences to both existing and potential customers.

Data Segmentation: Your Expert Guide
Understand what data segmentation is and why it’s vital in creating more efficient business decisions and a better customer experience.

2025 advertising trends: What brands and agencies should consider this year
We explore the key trends that will shape advertising this year and how to approach new opportunities and challenges when planning 2025 strategies.

Empowering emission insights: Harnessing data for a greener tomorrow
Find out how Experian data helped CSE's Calculator provide insight to over 300 local councils and thousands of individuals into their carbon consumption patterns.

Ask the Expert: Addressable TV advertising with Finecast (part two)
In part two of this insightful ‘Ask the Expert’ Q&A series, we delve into the complexities of defining audiences in data-driven TV advertising.

Big data or small data?
You don’t need big data or small data: you need the right data and insight to reach your prospect. Read more to find the best way to fuel your campaigns.
Three steps to creating added value for your customers
Marketers always talk about 'adding value'... But what does that actually mean and are your definitions aligned with those of your customers?

Salford City Council focus on tackling health inequalities
Learn how Experian's mosaic tool enabled Salford City Council to better understand and address various public health issues