
To start with let’s assess the wider UK impacts, for now focusing less on specific customer segments but the population in general. There will in any recession be winners and losers but at the highest aggregated level one would have to argue that Covid has not hit finances as hard as expected, due of course largely to the furlough scheme? We can see from the below Average Weekly Earnings chart that growth in the year to January was 4.1%. We can see a dip in 2020 but now well in to 2021 we can see positive signs of recovery; this is borne out by consumer confidence in their future finances reaching an all-time 3 yr high and a sharp rise in confidence in the next 12 months economy.
AWE – what pandemic?
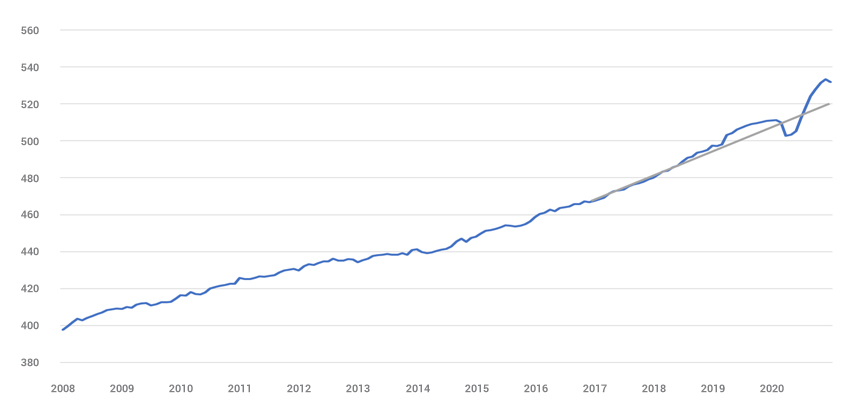
Average weekly earnings (nominal) – regular pay
Household savings have soared
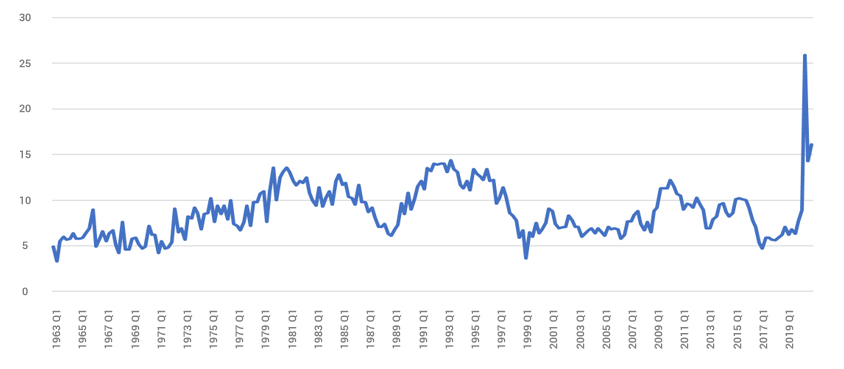
Households’ savings ratio (%): current price: £m: SA
Does the above point to everything being rosy in the financial garden? On the face of it one would have to say yes. But dig a little deeper into the numbers and we can see that much of this additional savings is being driven by certain UK sectors.
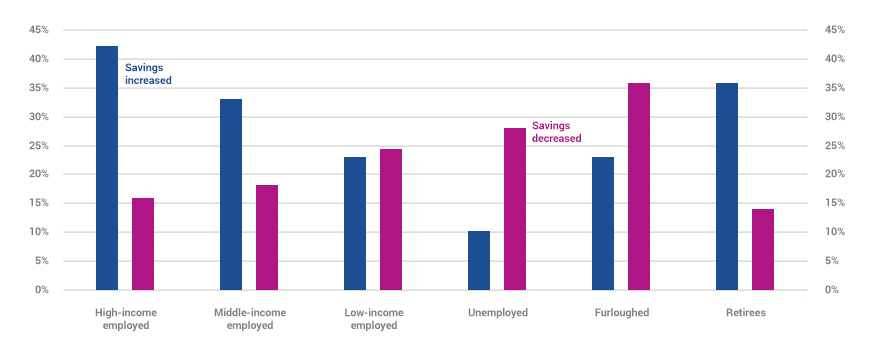
Percentage of household savings
Twenty-eight per cent of those surveyed for the above analysis had accumulated additional savings as a result of the pandemic. Just twenty eight percent of the typical population has accounted for this huge savings growth and just a quick assessment of the above chart shows us it is the higher income employed and retirees who have made this difference.
Interestingly, only 10% of the households that increased their savings (less than 3% of the whole sample) planned to spend the money they had saved.
It’s at this point we need to turn our attention from the wider UK market and start to focus on how segments have been impacted. We can clearly see the winner and loser gaps are widening more than ever before, understanding this background is key to understanding how and why certain segments are planning their financial futures. To do this, we will be using Experian’s financial strategy segments, a full view of the UK as to how varying segments fare financially through purchase, wealth and attitudes.

When we take 2019 gross income as our base the picture of recovery is starkly varied. Segments such as Money Makers (employed high earners) Accumulated wealth (HNW approaching retirement) will by the end of 2022 have clawed their way back and be earning up to 3% more than 2019, where conversely those segments such as Single Earners or Family pressures (as the name suggests, families struggling to make ends meet on a weekly basis) will be earning 4% less than in 2019. One UK group that continues on their own unique path is retirees, largely secure with pensions who consistently fare better than average. Time is yet to play out with these segments as pensions linked to the drawdown market may diverge away from final salary or annuity schemes still most prevalent in the retired sector.
An interesting point to note is that it is not until 2025 that every segment is back earning more than 2019, in the wealthiest case 13% more and in the less just 1%.
The next natural element to assess is spend. In many cases bills don’t go down and spend is not always discretionary, those struggling segments mentioned may already be spending most of their income on essentials, whereas those well off have more flex in cutting back.
Spend as a proportion of income
| FSS Code | FSS Name | 2019 | 2020 | 2021 | 2022 | 2023 | 2024 | 2025 |
| A | Earning Potential | 73% | 66% | 72% | 75% | 76% | 77% | 77% |
| B | Money Makers | 58% | 50% | 54% | 58% | 58% | 58% | 58% |
| C | Growth Phase | 65% | 58% | 63% | 67% | 67% | 67% | 67% |
| D | Deal Seekers | 70% | 63% | 69% | 73% | 74% | 74% | 74% |
| E | Family Pressures | 84% | 78% | 84% | 87% | 89% | 90% | 91% |
| F | Established Investors | 55% | 47% | 50% | 54% | 54% | 54% | 53% |
| G | Career Experience | 68% | 61% | 66% | 69% | 70% | 70% | 70% |
| H | Small-scale Savers | 76% | 70% | 75% | 80% | 81% | 81% | 82% |
| I | Mutual Resources | 73% | 65% | 71% | 75% | 76% | 76% | 77% |
| J | Single Earners | 78% | 71% | 77% | 81% | 82% | 83% | 84% |
| K | Respectable Reserves | 76% | 68% | 73% | 77% | 78% | 78% | 78% |
| L | Cash Economy | 89% | 83% | 87% | 90% | 92% | 93% | 94% |
| M | Golden Age | 88% | 78% | 82% | 86% | 87% | 87% | 88% |
| N | Home-equity Elders | 103% | 94% | 96% | 99% | 100% | 101% |