
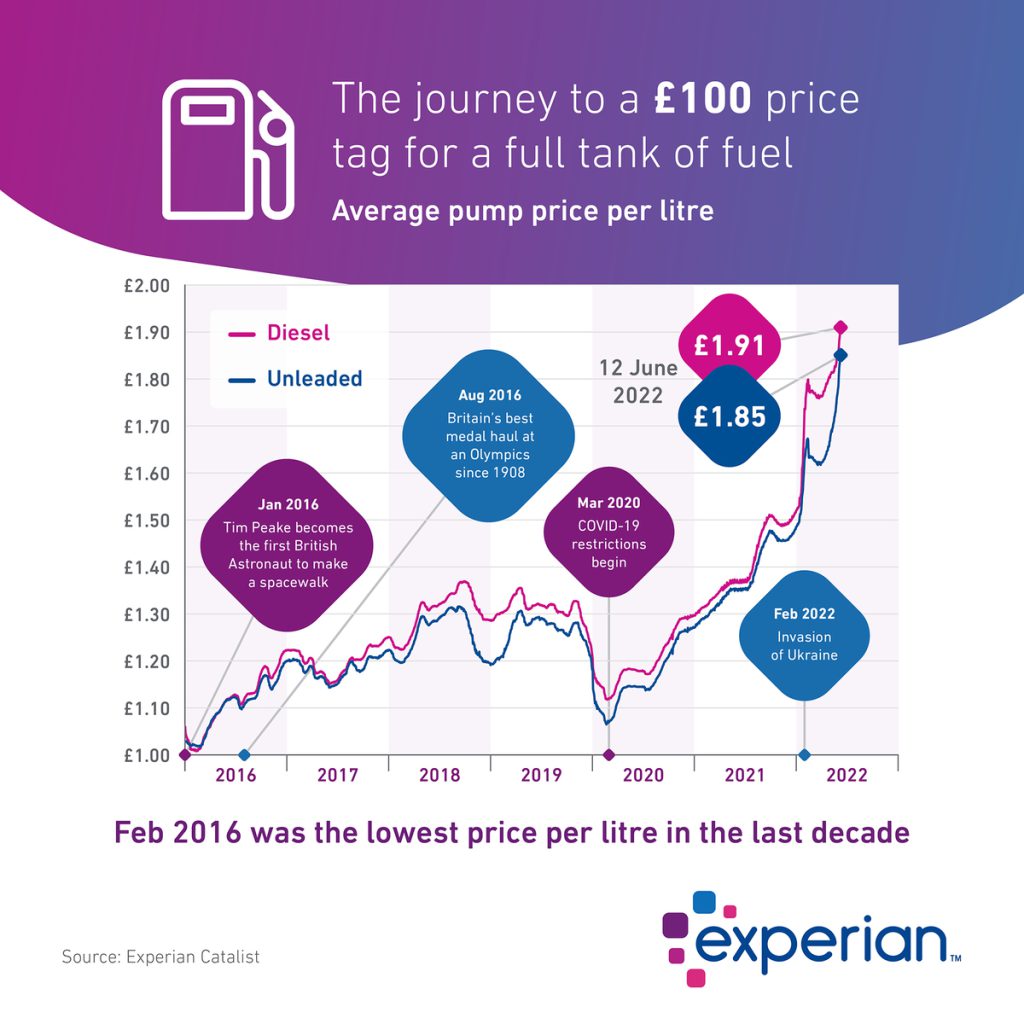
The sheer scale of price rises is brought to life in the graphic below, showing how fuel prices have increased dramatically since 2016. When astronaut Tim Peake was making his historic spacewalk in January 2016, a litre of unleaded petrol was just over £1. The following month, we saw the lowest fuel prices in the last decade.
Rising prices are impacting every single household, but the reality is that the least affluent are being hardest hit. With a greater percentage of their household income going on essentials such as food and energy, savvy budgeting is no longer enough to make ends meet, and many households are already struggling to cope. Being able to identify and support those in greatest need is now front of mind for local authorities, charities, and financial services providers.
For those in the squeezed middle, there are decisions to make as inflation continues to bite and pay increases fail to keep up with the rising cost of living. From putting off holidays and house renovations, to cutting back on eating out, to switching to cheaper brands and retailers.
According to the ONS1, three in four adults are worried about the rising cost of living, with around 68% already spending less on non-essentials to help balance budgets.
These shifts in consumer behaviour will have knock-on impacts on businesses in many different sectors. You will need to forecast and react to likely changes in consumer confidence and spending. You will also need to understand whether the consumers who are spending more are those who are brand loyal, or if you’re appealing to a whole new segment of the population.
What will happen next?
One of the hardest things to pinpoint is how individual areas and households are being affected, given the swift increase in the cost of living and different forecasted outcomes. The Bank of England expects inflation to peak at 11% in the autumn2, while other analysts think it could be higher.
Understanding the impacts on consumers now, and the likely impacts later in the year, will give you time to plan ahead and develop strategies in advance.
By using ONS data combined with our own economic analysis and demographic modelling, we can help you predict household incomes, alongside essential spending on items such as food, heating and lighting. Enabling you to define disposable weekly income in bands from £2000.
We can also help you to scenario plan, based on how key costs may fluctuate in the future, and the likely impact on households’ essential and non-essential spending. For example, what happens when fuel rises by 40%, or how would a 20% increase in food costs play out?
The scenario below shows what could happen. We’ve used 22 May as the baseline and a discretionary income of £500 or less each month after essential spending. 28% of households currently fall below this threshold.
If energy prices rise by 40% in October, we forecast another 4% of households could fall into the <£500 band. In addition, almost another 4% of households could fall into the negative discretionary income trap – unable to meet essential costs.
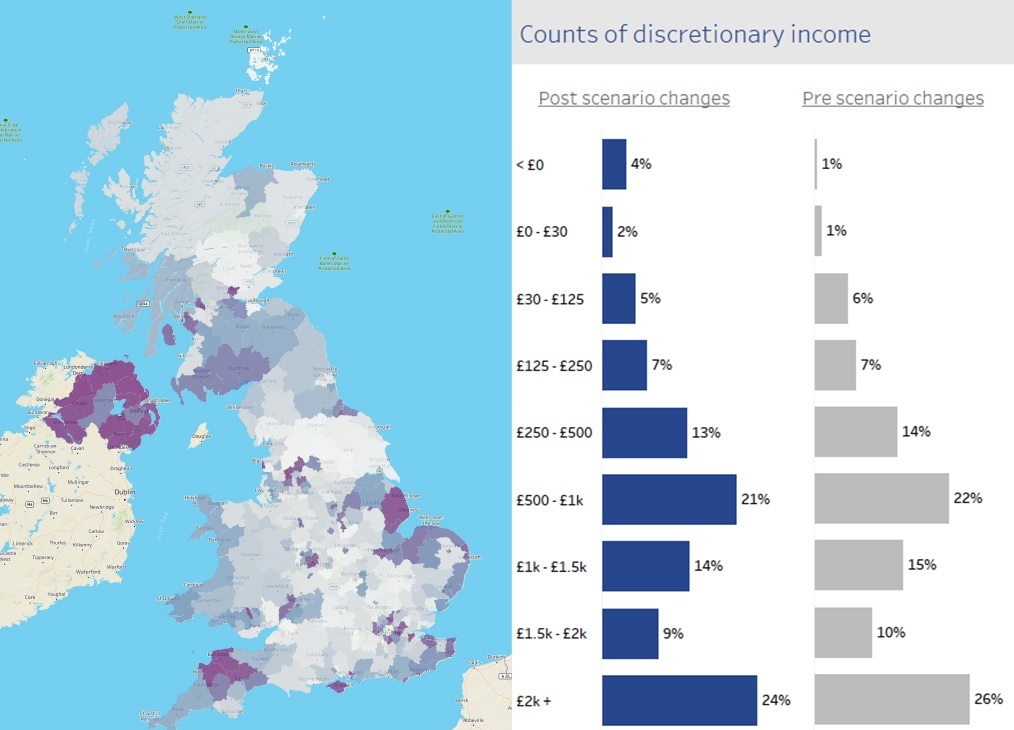
Figure 1: Forecast % area – 40% energy price increase
It is highly likely that food prices will continue to rise too, driven by a range of factors including Russia’s invasion of Ukraine, and Brexit. ONS data shows that the cost of some staples has increased significantly over the last year, with bread up by 16% and pasta by 50%3.
In the scenario above, we’ve factored in a food price rise of 20%, at the same time as the energy increase. If that happens, we predict another 3% of households will fall into the negative discretionary income trap. Overall, 35% of households would have £500 or less left to spend each month, after covering essential costs.
Mapping these changes at a local level reveals hotspots around the UK where the need for support will be greater. For example, areas in the South West, along the East Coast, and certain London regions.
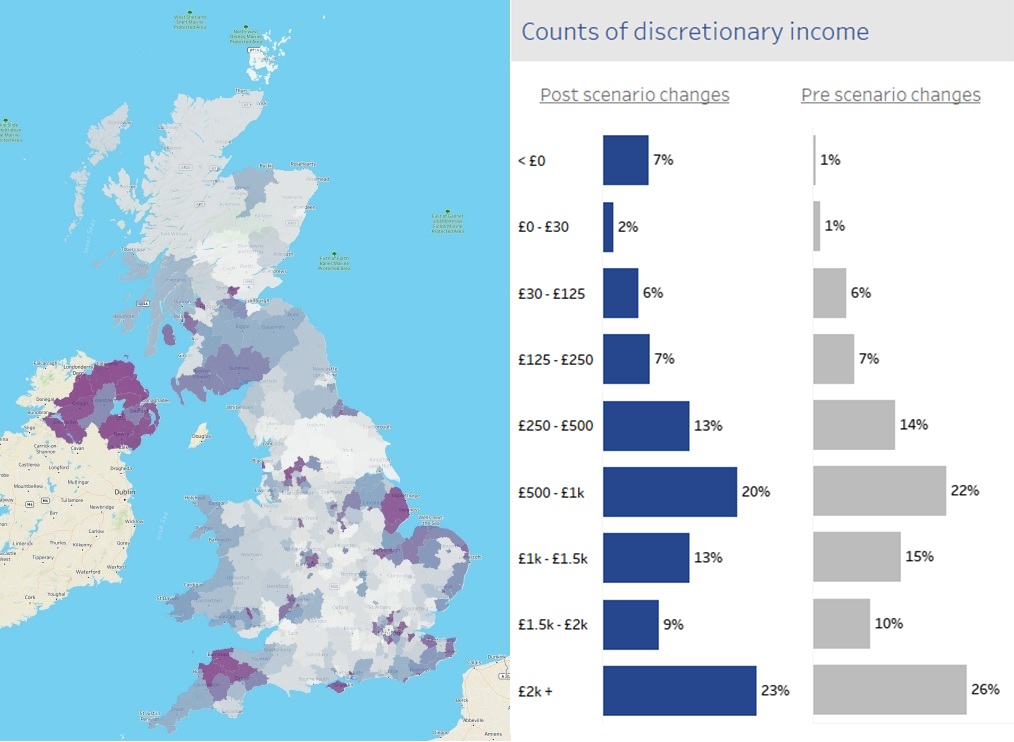
Figure 2: Forecast % area – 40% energy price increase and 20% food price Increase
Some areas are more at risk than others
To plan ahead, it’s essential that organisations understand the local impacts of rising prices. We can help you drill down into the data and see what’s happening where you are. Taking North Devon as an example, we can see that only 1% of households were in the negative discretionary income band. However, based on our forecasted price rise scenarios for energy and food, this would jump to 16% of households.
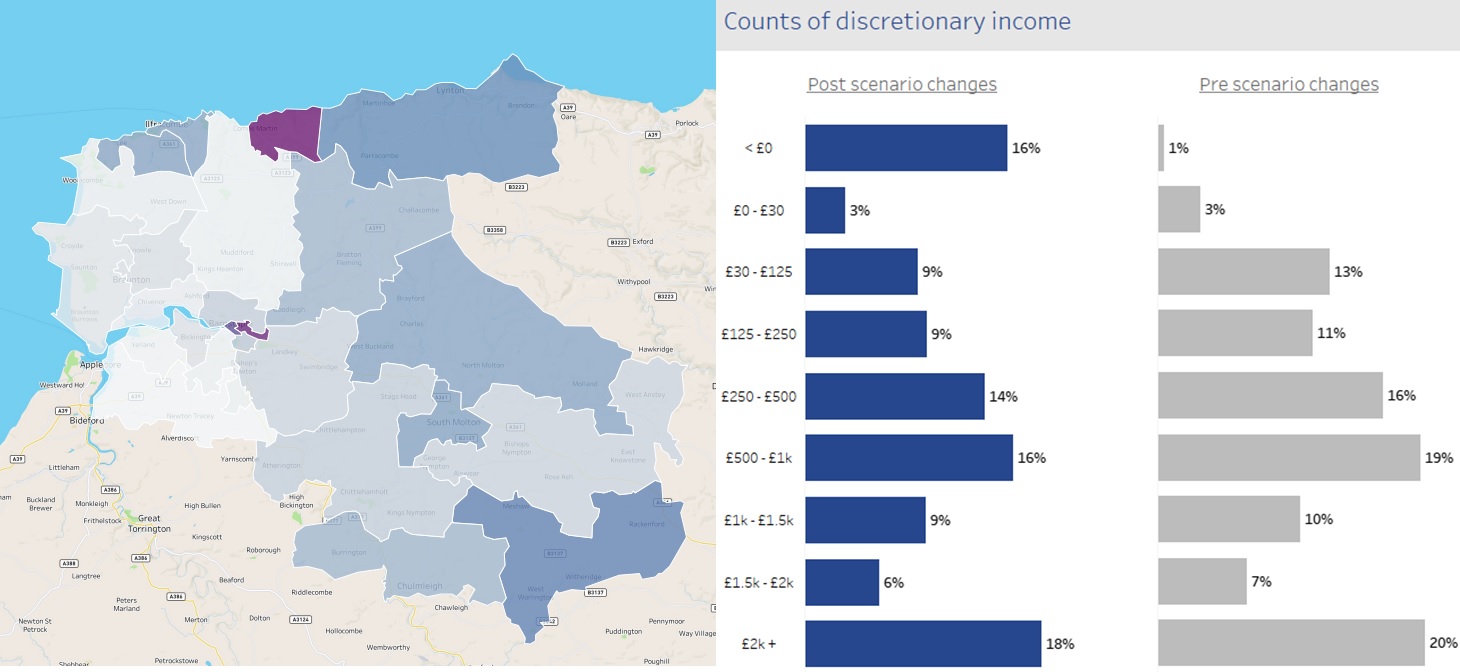
Figure 3: Forecast % area – 40% energy price increase and 20% food price increase – spotlight on North Devon
This type of insight can be used in many different ways to help better support communities and businesses. We know that not all Mosaic groups will be impacted in the same way. Our Family Basics group are predicted to lose nearly 21% of their discretionary income, whereas the City Prosperity group are likely to lose around 5%. Keeping a close eye on market trends and how your customer segments are evolving using Mosaic will help you plan ahead and adapt your strategies. Keeping you closer to changing customer needs in uncertain times.
Our forecasts also show the likely impact of reduced non-essential spending on different sectors. Potentially, the biggest impact could be within recreation and culture, a sector already recovering from the impact of Covid-19.
The cost of living crisis is undoubtedly a challenge. However, we can help you adapt as the situation evolves and develop strategies to navigate through the crisis. Enabling you to support those most in need and react to changing consumer behaviour.
If you’d like to find out more about the insight on which this article was based then please contact us.
Sources
[1] Worries about the rising costs of living, Great Britain: April to May 2022, Office for National Statistics
[2] UK inflation hits fresh 40-year high of 9.4% and ‘could hit 12% in October’, The Guardian
[3] Budget pasta prices jump 50% as food staples rise, BBC News