
To start with let’s assess the wider UK impacts, for now focusing less on specific customer segments but the population in general. There will in any recession be winners and losers but at the highest aggregated level one would have to argue that Covid has not hit finances as hard as expected, due of course largely to the furlough scheme? We can see from the below Average Weekly Earnings chart that growth in the year to January was 4.1%. We can see a dip in 2020 but now well in to 2021 we can see positive signs of recovery; this is borne out by consumer confidence in their future finances reaching an all-time 3 yr high and a sharp rise in confidence in the next 12 months economy.
AWE – what pandemic?
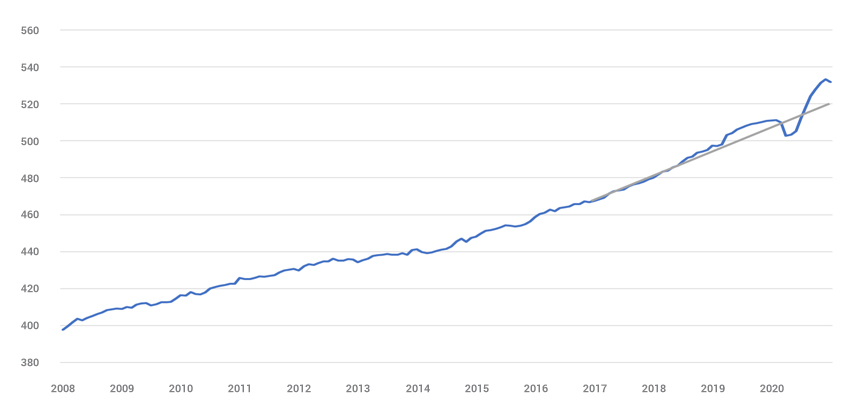
Average weekly earnings (nominal) – regular pay
Household savings have soared
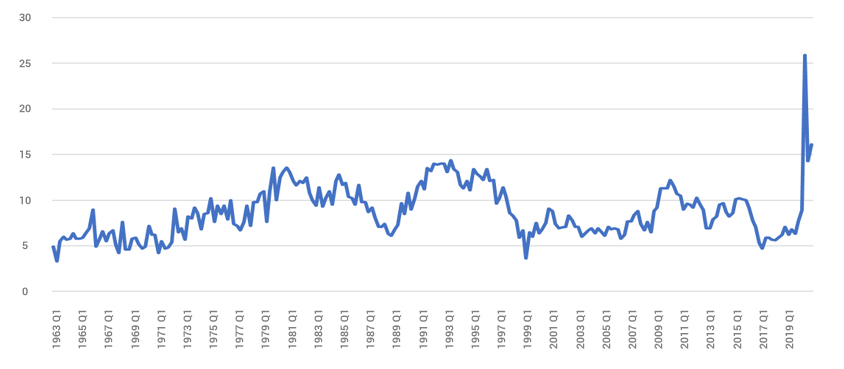
Households’ savings ratio (%): current price: £m: SA
Does the above point to everything being rosy in the financial garden? On the face of it one would have to say yes. But dig a little deeper into the numbers and we can see that much of this additional savings is being driven by certain UK sectors.
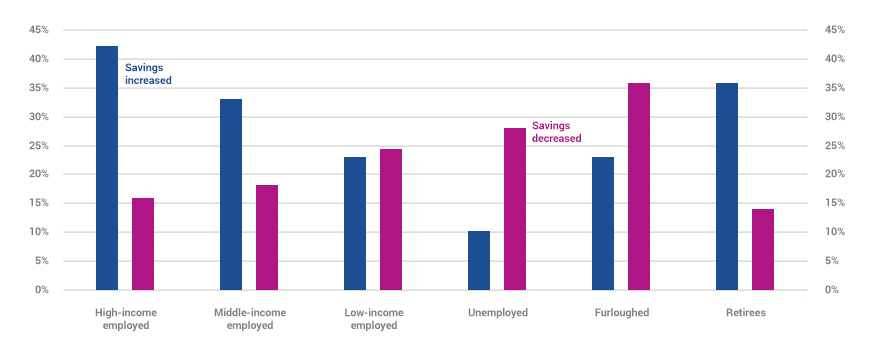
Percentage of household savings
Twenty-eight per cent of those surveyed for the above analysis had accumulated additional savings as a result of the pandemic. Just twenty eight percent of the typical population has accounted for this huge savings growth and just a quick assessment of the above chart shows us it is the higher income employed and retirees who have made this difference.
Interestingly, only 10% of the households that increased their savings (less than 3% of the whole sample) planned to spend the money they had saved.
It’s at this point we need to turn our attention from the wider UK market and start to focus on how segments have been impacted. We can clearly see the winner and loser gaps are widening more than ever before, understanding this background is key to understanding how and why certain segments are planning their financial futures. To do this, we will be using Experian’s financial strategy segments, a full view of the UK as to how varying segments fare financially through purchase, wealth and attitudes.

When we take 2019 gross income as our base the picture of recovery is starkly varied. Segments such as Money Makers (employed high earners) Accumulated wealth (HNW approaching retirement) will by the end of 2022 have clawed their way back and be earning up to 3% more than 2019, where conversely those segments such as Single Earners or Family pressures (as the name suggests, families struggling to make ends meet on a weekly basis) will be earning 4% less than in 2019. One UK group that continues on their own unique path is retirees, largely secure with pensions who consistently fare better than average. Time is yet to play out with these segments as pensions linked to the drawdown market may diverge away from final salary or annuity schemes still most prevalent in the retired sector.
An interesting point to note is that it is not until 2025 that every segment is back earning more than 2019, in the wealthiest case 13% more and in the less just 1%.
The next natural element to assess is spend. In many cases bills don’t go down and spend is not always discretionary, those struggling segments mentioned may already be spending most of their income on essentials, whereas those well off have more flex in cutting back.
Spend as a proportion of income
| FSS Code | FSS Name | 2019 | 2020 | 2021 | 2022 | 2023 | 2024 | 2025 |
| A | Earning Potential | 73% | 66% | 72% | 75% | 76% | 77% | 77% |
| B | Money Makers | 58% | 50% | 54% | 58% | 58% | 58% | 58% |
| C | Growth Phase | 65% | 58% | 63% | 67% | 67% | 67% | 67% |
| D | Deal Seekers | 70% | 63% | 69% | 73% | 74% | 74% | 74% |
| E | Family Pressures | 84% | 78% | 84% | 87% | 89% | 90% | 91% |
| F | Established Investors | 55% | 47% | 50% | 54% | 54% | 54% | 53% |
| G | Career Experience | 68% | 61% | 66% | 69% | 70% | 70% | 70% |
| H | Small-scale Savers | 76% | 70% | 75% | 80% | 81% | 81% | 82% |
| I | Mutual Resources | 73% | 65% | 71% | 75% | 76% | 76% | 77% |
| J | Single Earners | 78% | 71% | 77% | 81% | 82% | 83% | 84% |
| K | Respectable Reserves | 76% | 68% | 73% | 77% | 78% | 78% | 78% |
| L | Cash Economy | 89% | 83% | 87% | 90% | 92% | 93% | 94% |
| M | Golden Age | 88% | 78% | 82% | 86% | 87% | 87% | 88% |
| N | Home-equity Elders | 103% | 94% | 96% | 99% | 100% | 101% | 103% |
| O | Declining Years | 100% | 93% | 95% | 97% | 99% | 100% | 101% |
A similar picture is portrayed as we assess spend as a proportion of income. The segments already mentioned such as Single Earners and Family Pressures by 2025 will end up spending an increased proportion of income, not surprising as we now know such income will not be rising or catching up anywhere near the increasing prices of day to day living. If there was a wealth gap before, Covid has exacerbated the issue for the foreseeable future!
If you want to understand the financial status and behaviours of your customers, contact us for a free profile assessment
Contact usSharks and Lifeboats
So far we have seen what looks like a picture of financial contentment in the UK with savings rising and average weekly earnings recovering, but unphased we have dug deeper to find serious shades of grey in the recovery with those doing well and not so. This at last leads us to those sharks and lifeboaters which in turn will enable any financial organisation to make intelligent decisions and strategies based on key segments. The hypothesis is that when faced with times of trouble certain groups will start hunting best deals, loyalty goes out the window as they swap or, change mortgage providers to save those £’s. This behaviour is driven out of an ideal position of comfort and confidence or a financial astuteness to exploit a marketplace where companies are desperate to attract business with offers.

On the flip side if trouble looms and you are not confident of weathering the storm you stick with your current provider, your “lifeboat” as it were. The mentality more than likely being if you have shown loyalty to them, when the chips are down, they know you, they will pay back some of that prior loyalty by overlooking the overdraft fee or sending the letters stating their “disappointment”.
Since Covid began we have been tracking segment attitudes to financial products and what they see themselves doing in the next 12 months. The results are ongoing and ever changing but some key facts remain bearing out the above thinking.
One area that suffers in general tends to be products that could be described as non-essential right now, such as Over 50’s protection or longer term tied in investments, the attitude being to look after today’s money and perhaps worry about tomorrow when the storm settles. The one notable exception is being critical illness cover where intention to purchase rises sharply in key wealth working segments.
If we look at other key points:
- Lifeboaters dominate the current account switching market, its declining in time of uncertainty but those well off retired or soon to be retired segments show an increase of 20% in likelihood to swap. These have large investment pots and have the time and wherewithal to shop around.
- When it comes to mortgage switching, our usual suspects such as the segment Deal Seekers think they will stay put, perhaps better the devil you know. But the more confident mid-range families and well off pre retirees are on the hunt for better deals. Confident in their own position and of being accepted.
- The Loans market is one that reacts quickly to environmental forces. Our Family Pressures segment is now half as likely to look for an unsecured loan considering their affordability, whereas conversely the single earners show a marked increase demonstrating a need to make ends meet given they will be spending much more as a percentage of earning. Our sharks potentially still exist, the wealthiest segment Established Investors show a 25% increase in likelihood to take out a loan deciding to benefit from potentially low interest rates and keep their savings as we know few have the intention of spending it.
We could carry on describing change after change, but to summarise in some key points:
- The UK appears to be doing well, but there are key variances in segments as to recovery rates and impacts.
- Consumers overall will not be at 2019 earning levels until 2025, but those well off and retired segments will be back on par in 12 months.
- More than ever financial decisions are being made on future perceptions as much as current situations. As the mood changes so will consumers plans for the future and thus their product take up. It will be essential for the next few years to consistently track those changes.
- Finally, understanding which customers will stay on their lifeboat, be hard to acquire, but easier to keep will be as important as understanding those sharks looking for deals in the acquisition market but ready to head away the moment a better deal looms ahead.