H3 spatial indexing: Why use hex grids in location-based marketing?
H3 geospatial indexing: Unlock new insights for marketing and location strategy
As the world becomes increasingly interconnected, traditional data analysis tools can struggle to keep up. Given the complexities of the many diverse types of data available to organisations looking to operate across multiple regions, the need for more evolved data analysis tools is growing.
At Experian, we’re seeing many of our clients, who are implementing location intelligence decisioning, now moving towards Hierarchical Hexagonal Indexing, also known as “H3”. H3 is a flexible global geospatial tiling system which helps to unlock insights that fuel business opportunity.
What is H3 hexagonal grid mapping?
What is H3 hexagonal grid mapping?
H3 is a global grid indexing system facilitating spatial data analysis to tessellate the Earth’s surface, allowing for efficient indexing and querying of spatial data at multiple levels of detail.
H3[1] is a global grid indexing system and library developed by Uber to facilitate spatial data analysis. The H3 system uses a hierarchical hexagonal grid to tessellate the Earth’s surface, allowing for efficient indexing and querying of spatial data at multiple levels of detail. The hexagonal grid provides a more natural representation of the Earth’s surface than traditional rectangular grids. It enables enhanced indexing of spatial data and makes it easy to link multiple data sets from different sources together quickly.
The H3 system offers 16 different resolutions, with each resolution corresponding to a different size of hexagon. Higher resolutions result in smaller hexagons, allowing for more granular analysis of spatial data. When data is indexed using H3, each spatial feature is associated with one or more H3 cell IDs, which can be used to identify the feature and perform spatial queries on it.
H3 is an open-source project, with a library of functions available for a variety of programming languages, making it easy for developers to incorporate H3 into their applications. The system has proven to be highly scalable and efficient, making it ideal for analysing large volumes of spatial data.
What does the H3 hexagonal grid mapping look like?
As you can see from the example image below, there are varying sizes of the hexagons which are the fundamental building blocks of the H3 grid. The grid is presented as a grid overlay on the map with each cell assigned a colour based on its size or resolution.
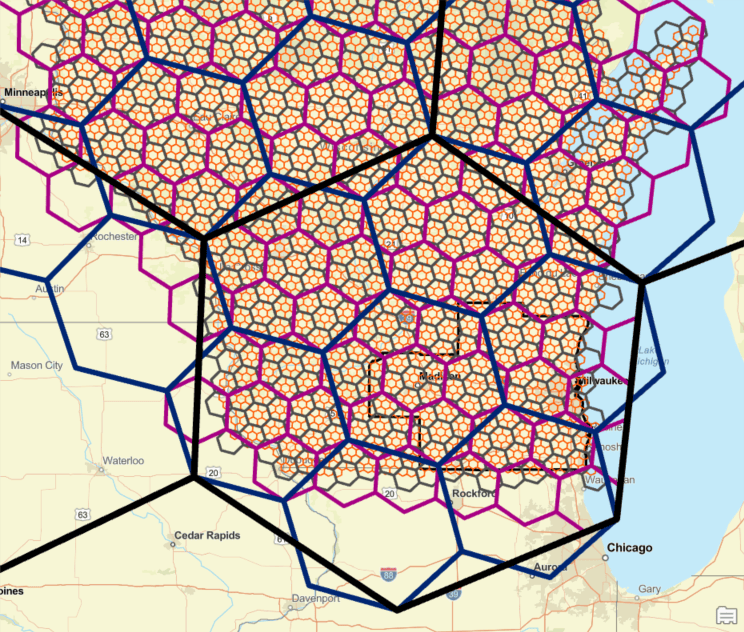
This visual representation of spatial data and the results of special queries may be displayed on maps using a visualisation platform, but the spatial index itself is primarily a behind-the-scenes structure facilitating efficient data retrieval and analysis.
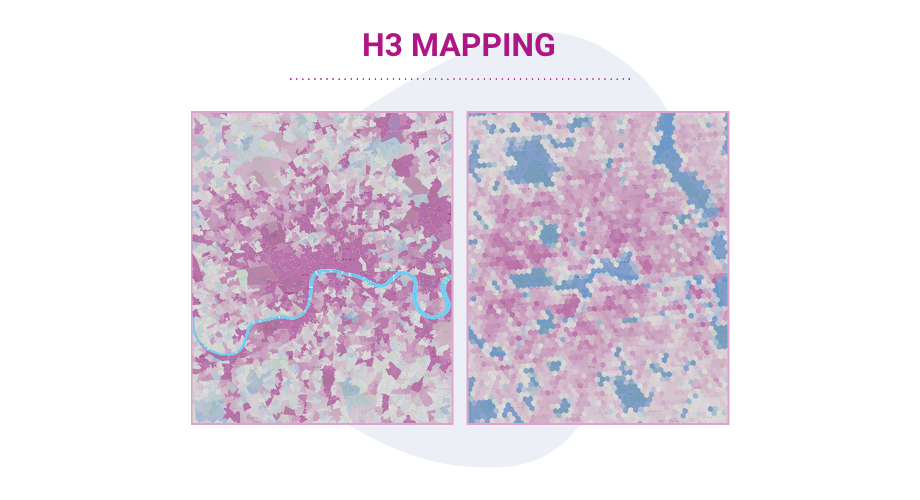
The maps show the number of households in London, with the map on the left showing a standard administrative level of geography: Lower Super Output Areas (LSOAs). The map on the right displays theH3resolution 9 grid.The LSOAs vary significantly in size, making it difficult to carry out analysis, as they do not provide a comparable spatial unit. Conversely,H3resolution 9 is a spatial unit at a fine level of granularity, providing the ability to measure between consistent sized cells. As a result,H3acts as a standard unit and can be used to join disparate data sets, making it ideal for spatial analysis.
The maps show the number of households in London, with the map on the left showing a standard administrative level of geography: Lower Super Output Areas (LSOAs). The map on the right displays theH3resolution 9 grid.The LSOAs vary significantly in size, making it difficult to carry out analysis, as they do not provide a comparable spatial unit. Conversely,H3resolution 9 is a spatial unit at a fine level of granularity, providing the ability to measure between consistent sized cells. As a result,H3acts as a standard unit and can be used to join disparate data sets, making it ideal for spatial analysis.
How can H3 hex mapping improve your business decisions?
From our experience organisations are leveraging the grid system to layer different sources of insight on a consistent framework, which can be used to blend and correlate metrics within areas such as:
1. Audience planning
Audience planning involves understanding target audiences and defining strategies to effectively reach and engage with them. H3 indexing is a valuable tool for planning, due to its ability to segment geographic areas into specific H3 cells. Marketers can analyse data within each H3 cell to gain insights into the characteristics, demographics, and behaviours of the audience in that location. With H3’s hierarchical hexagonal grid, marketers can identify areas of interest at different resolutions. This allows for precise targeting and tailoring of marketing campaigns based on customer preferences and demographics by H3 cell.
2. Marketing activation
H3 indexing can play a crucial role in marketing activation, by enabling precise targeting and location-based activation. Marketers can utilise H3 cells to identify specific geographic areas where they want to activate their marketing campaigns. By understanding foot traffic patterns, customer density and demographic data within each H3 cell, marketers can plan and execute marketing activations such as advertising, promotions, events, or personalised messaging tailored to the characteristics of each location. Using H3, businesses can deliver relevant and personalised marketing messages, using a privacy sensitive approach.
3. Location investment decisions
H3 can be used to optimise locations by analysing data and identifying areas with high demand. This location intelligence can help businesses to size markets, benchmark performance and make more informed investment or product ranging decisions. It can also help retailers to decide where to open new stores or expand existing ones. It can also help to prioritise locations in out of home (OOH) advertising.
The benefits of geospatial indexing
Don’t just take our word for it – here are some testimonials from clients who have already experienced the benefits of geospatial indexing for their WorldView data:
Kalibrate’s location intelligence team chose Experian international data insights to support a leading pizza delivery clients store expansion strategy across over 20 countries. Having compared international data assets available in the market, Experian coverage and standardisation of data variables was compelling providing us with an easy to implement consistent view across countries. Their grid level approach gives considerable advantage, reducing speed to actionable insight from months to weeks and allowing timely real estate planning decisions at both a macro and micro level.
Anthony Vanikiotis, Kalibrate
How can we help?
At Experian, we’re excited to see the impact that H3 geospatial indexing will have on our client’s data analysis, and we can’t wait to see what insights they will uncover with this powerful way of analysing and linking data.
Interested in learning more about the H3 global grid indexing system and library? We recommend checking out the following resource: h3geo.org/docs
Get in touch
Get in touch if you have any questions about H3 geospatial indexing or accessing Marketing Services data at H3 level.
Get in touchFurther reading

Make the best business and marketing data-driven decisions across Europe
To make the best marketing decisions across Europe, organisations need to fully understand local markets. Find out how Experian's WorldView platform can help.

Why geo strategies should be part of your digital marketing planning
During the past couple of years, as advertisers and their agencies continue to strive for these efficiencies and some form of consistent performance and measurement across platforms, we have seen greater power and share of wallet move to the walled…

5 ways location intelligence can help optimise supply chain management
Explore how businesses can use the collection of geospatial data to gain insight into operations, optimise their supply chain management and improve delivery times

Reaching high-intent travel audiences this winter
Find out how to ensure your campaigns stand out and resonate with the right audience at just the right time, and turn their travel aspirations into bookings

Cookieless targeting: Six alternatives for targeted marketing
Learn about cookieless targeting in digital advertising and explore six solutions as we dissect their strengths and limitations.

Data for Good – Creating the UK Numeracy Index
Find out how Experian supported National Numeracy to identify and help individuals improve their financial literacy and confidence in numbers.

Using data to create the perfect donor experience
Get a clearer view of your donors, build trust and deliver more effective messaging. Explore how your charity can benefit from data enrichment.

Big data or small data?
You don’t need big data or small data: you need the right data and insight to reach your prospect. Read more to find the best way to fuel your campaigns.

Using data and email to support the most vulnerable with Northern Powergrid
Working with Experian, Northern Powergrid were able to target and communicate with their audience for significant uplift in PSR registrations. Find out more.

6 best practices for implementing a successful segmentation project
So many organisations fail to properly understand who they are marketing to. We explore 6 top tips to implementing a successful segmentation project.
[1] H3 – Introduction, Hexagonal hierarchical geospatial indexing system